# Importing pandas and matplotlib
import pandas as pd
import matplotlib.pyplot as plt
import seaborn as sns

# Start coding!Project: Investigating Netflix Movies

Netflix! What started in 1997 as a DVD rental service has since exploded into one of the largest entertainment and media companies.
Given the large number of movies and series available on the platform, it is a perfect opportunity to flex your exploratory data analysis skills and dive into the entertainment industry. Our friend has also been brushing up on their Python skills and has taken a first crack at a CSV file containing Netflix data. They believe that the average duration of movies has been declining. Using your friends initial research, you’ll delve into the Netflix data to see if you can determine whether movie lengths are actually getting shorter and explain some of the contributing factors, if any.
You have been supplied with the dataset netflix_data.csv , along with the following table detailing the column names and descriptions:
The data
netflix_data.csv
| Column | Description |
|---|---|
show_id |
The ID of the show |
type |
Type of show |
title |
Title of the show |
director |
Director of the show |
cast |
Cast of the show |
country |
Country of origin |
date_added |
Date added to Netflix |
release_year |
Year of Netflix release |
duration |
Duration of the show in minutes |
description |
Description of the show |
genre |
Show genre |
Importing pandas and matplotlib
Load the CSV file and store as netflix_df.
#Load the CSV file and store as netflix_df.
netflix_df = pd.read_csv("datasets/netflix_data.csv")
netflix_df.head(2)| show_id | type | title | director | cast | country | date_added | release_year | duration | description | genre | |
|---|---|---|---|---|---|---|---|---|---|---|---|
| 0 | s1 | TV Show | 3% | NaN | João Miguel, Bianca Comparato, Michel Gomes, R... | Brazil | August 14, 2020 | 2020 | 4 | In a future where the elite inhabit an island ... | International TV |
| 1 | s2 | Movie | 7:19 | Jorge Michel Grau | Demián Bichir, Héctor Bonilla, Oscar Serrano, ... | Mexico | December 23, 2016 | 2016 | 93 | After a devastating earthquake hits Mexico Cit... | Dramas |
Filter the data to remove TV shows and store as netflix_subset
#Filter the data to remove TV shows and store as netflix_subset
netflix_subset = netflix_df[netflix_df.type!='TV Show']
netflix_subset.head()| show_id | type | title | director | cast | country | date_added | release_year | duration | description | genre | |
|---|---|---|---|---|---|---|---|---|---|---|---|
| 1 | s2 | Movie | 7:19 | Jorge Michel Grau | Demián Bichir, Héctor Bonilla, Oscar Serrano, ... | Mexico | December 23, 2016 | 2016 | 93 | After a devastating earthquake hits Mexico Cit... | Dramas |
| 2 | s3 | Movie | 23:59 | Gilbert Chan | Tedd Chan, Stella Chung, Henley Hii, Lawrence ... | Singapore | December 20, 2018 | 2011 | 78 | When an army recruit is found dead, his fellow... | Horror Movies |
| 3 | s4 | Movie | 9 | Shane Acker | Elijah Wood, John C. Reilly, Jennifer Connelly... | United States | November 16, 2017 | 2009 | 80 | In a postapocalyptic world, rag-doll robots hi... | Action |
| 4 | s5 | Movie | 21 | Robert Luketic | Jim Sturgess, Kevin Spacey, Kate Bosworth, Aar... | United States | January 1, 2020 | 2008 | 123 | A brilliant group of students become card-coun... | Dramas |
| 6 | s7 | Movie | 122 | Yasir Al Yasiri | Amina Khalil, Ahmed Dawood, Tarek Lotfy, Ahmed... | Egypt | June 1, 2020 | 2019 | 95 | After an awful accident, a couple admitted to ... | Horror Movies |
Investigate the Netflix movie data, keeping only the columns “title”, “country”, “genre”, “release_year”, “duration”, and saving this into a new DataFrame called netflix_movies.
#Investigate the Netflix movie data, keeping only the columns "title", "country", "genre", "release_year", "duration", and saving this into a new DataFrame called netflix_movies.
netflix_movies = netflix_subset[["title", "country", "genre", "release_year", "duration"]]
netflix_movies.head(10)| title | country | genre | release_year | duration | |
|---|---|---|---|---|---|
| 1 | 7:19 | Mexico | Dramas | 2016 | 93 |
| 2 | 23:59 | Singapore | Horror Movies | 2011 | 78 |
| 3 | 9 | United States | Action | 2009 | 80 |
| 4 | 21 | United States | Dramas | 2008 | 123 |
| 6 | 122 | Egypt | Horror Movies | 2019 | 95 |
| 7 | 187 | United States | Dramas | 1997 | 119 |
| 8 | 706 | India | Horror Movies | 2019 | 118 |
| 9 | 1920 | India | Horror Movies | 2008 | 143 |
| 10 | 1922 | United States | Dramas | 2017 | 103 |
| 13 | 2,215 | Thailand | Documentaries | 2018 | 89 |
Filter netflix_movies to find the movies that are shorter than 60 minutes, saving the resulting DataFrame as short_movies; inspect the result to find possible contributing factors.
#Filter netflix_movies to find the movies that are shorter than 60 minutes, saving the resulting DataFrame as short_movies; inspect the result to find possible contributing factors.
short_movies = netflix_movies[netflix_movies.duration<60]
short_movies.head(2)
print(short_movies.shape)
(420, 5)short_movies.columnsIndex(['title', 'country', 'genre', 'release_year', 'duration'], dtype='object')sns.countplot(y='genre', data=short_movies)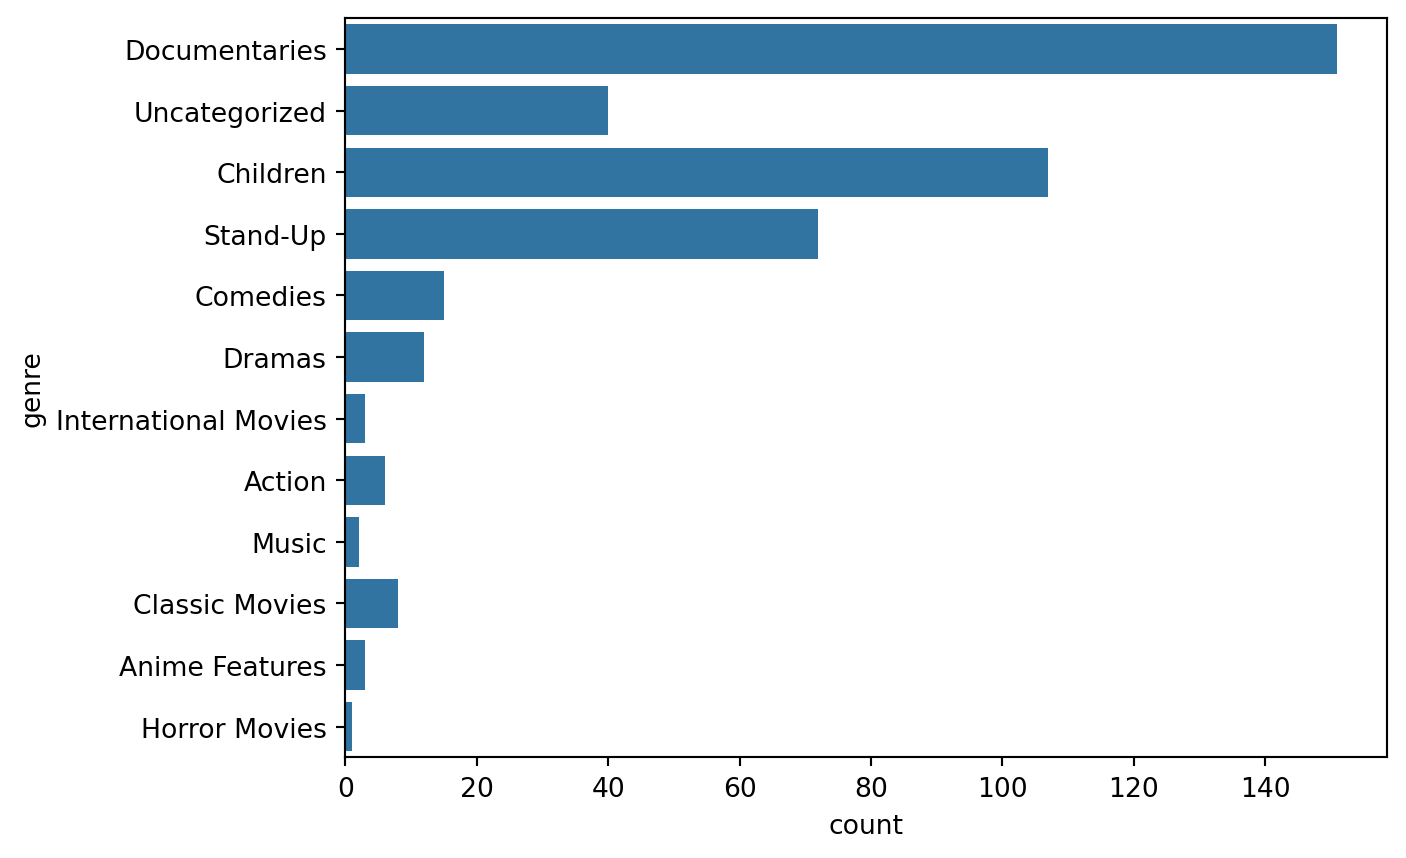
Genre of the top four movies are Documentaries, Children, Standup and Uncategorized
Using a for loop and if/elif statements, iterate through the rows of netflix_movies and assign colors of your choice to four genre groups (“Children”, “Documentaries”, “Stand-Up”, and “Other” for everything else). Save the results in a colors list.
#Using a for loop and if/elif statements, iterate through the rows of netflix_movies and assign colors of your choice to four genre groups ("Children", "Documentaries", "Stand-Up", and "Other" for everything else). Save the results in a colors list. "
colors = []

for index, row in netflix_movies.iterrows():
    genre = row['genre']
    if genre == "Children":
        colors.append("blue")  # Assigning blue for Children genre
    elif genre == "Documentaries":
        colors.append("green")  # Assigning green for Documentaries genre
    elif genre == "Stand-Up":
        colors.append("yellow")  # Assigning yellow for Stand-Up genre
    else:
        colors.append("red")  # Assigning red for Other genres

#print(colors)
Initialize a figure object called fig and create a scatter plot for movie duration by release year using the colors list to color the points and using the labels “Release year” for the x-axis, “Duration (min)” for the y-axis, and the title “Movie Duration by Year of Release
#Initialize a figure object called fig and create a scatter plot for movie duration by release year using the colors list to color the points and using the labels "Release year" for the x-axis, "Duration (min)" for the y-axis, and the title "Movie Duration by Year of Release
fig, ax = plt.subplots()
ax.scatter(netflix_movies['release_year'],netflix_movies['duration'],color=colors)
ax.set_xlabel("Release year")
ax.set_ylabel("Duration (min)")
ax.set_title("Movie Duration by Year of Release")

plt.show()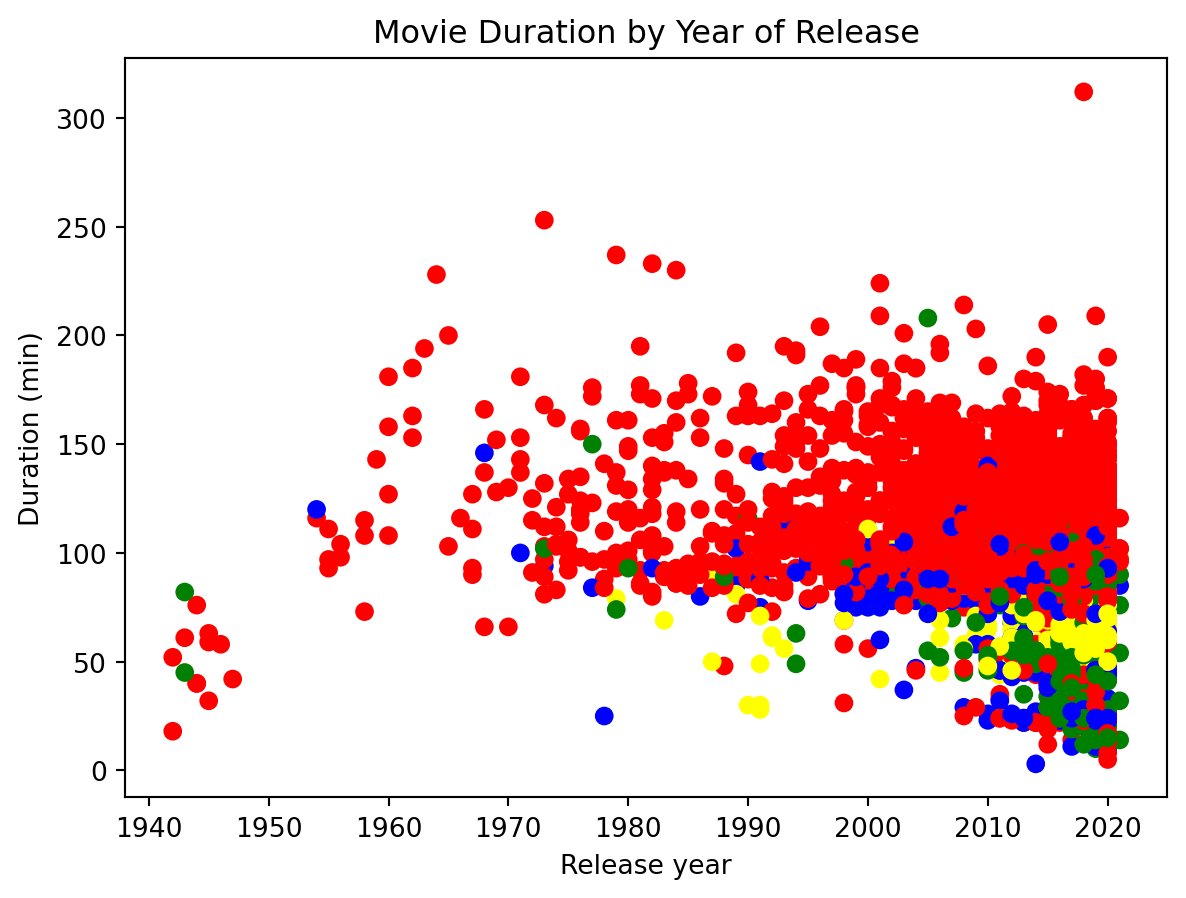
answer="maybe"